Synthetic Data Evaluation
Introduction
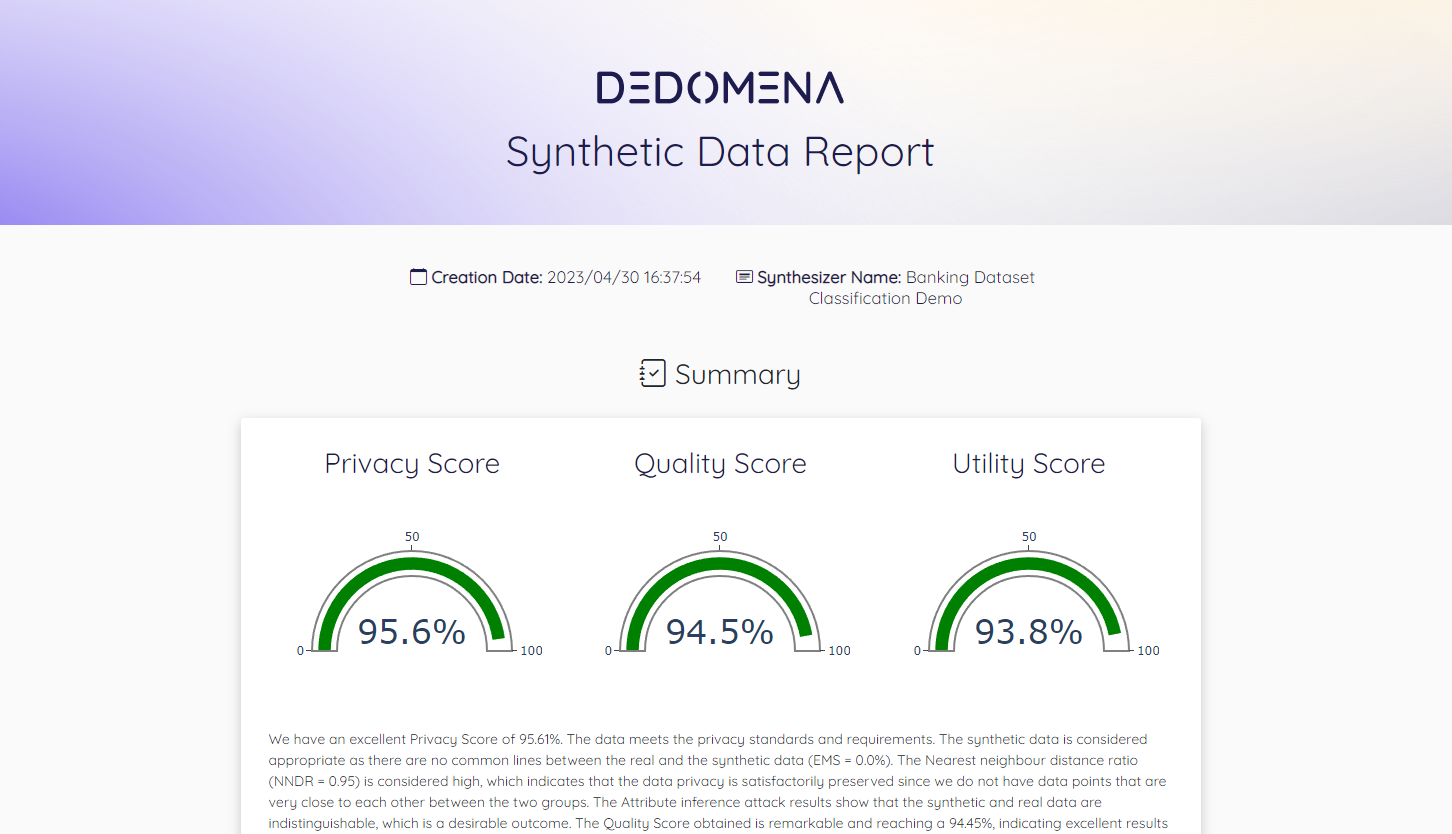
Once one of Dedomena's synthesization algorithms is trained, Nucleus provides a summary in the Nucleus Edge version and a report in the edge and cloud versions. To get the report using the Nucleus Edge version, the synthesizer must be uploaded on the platform.
To calculate the metrics and scores, a sample of real and synthetic data is taken, achieving the results as quickly as possible and avoiding bottlenecks.
Scores
In order to simplify and glimpse how secure and valuable the data is, Dedomena provides three scores:
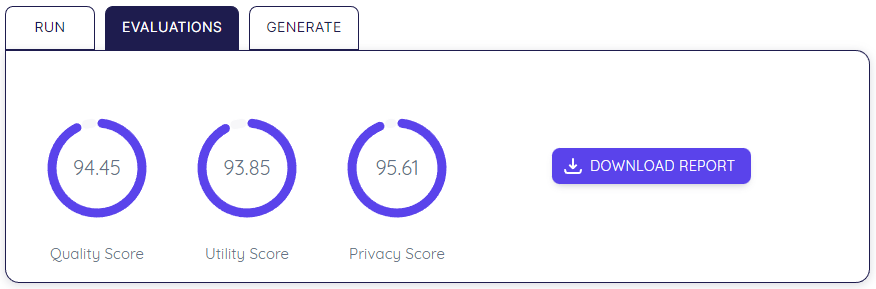
-
Privacy: How private and secure is the synthetic data.
-
Quality: How good is the synthetic data maintaining the value, patterns, statistics, relationships, etc.
-
Utility: Robustness of synthetic data to replace real data for Machine Learning tasks.
Metrics
Dedomena provides metrics for each dimension of the synthetic data that it analyzes and measures: privacy, quality, and utility.
Privacy
-
Distance to the closest record (DCR): It can be interpreted as the “smallest” distance between each element of real data and synthetic data. The metric takes non negative values, where 0 represents the worst possible outcome.
-
Exact Match Score (EMS): Percentage of rows shared between synthetic and real data. The metric takes [0, 1], where 0 represents the best outcome.
-
Nearest Neighbour Distance Ratio (NNDR): This metric is defined as the ratio between the smallest distance between an element in the real dataset and the second smallest distance. The metric takes values on [0, 1], with 1 being the optimal value.
-
Attribute Inference Attack (AIA): The are different types of inference attacks. In this case, the metric measure if it's possible to distinguish between real and synthetic data, making it possible for an attacker to extract information from the real data through the synthetic. The metric takes values on [0, 1], with 1 being the optimal value.
Quality
-
Mean Correlation Score (MCS): It is based on the calculation of the mean absolute difference between the correlations of the variables in both the real and synthetic data. This metric typically fluctuates between 0 and 1, but in some cases, it may exceed 1. In such cases, the value of 1 can be used as a reference value. Here, the value of 0 represents the optimal one.
-
Cramér's V MSE Score (CVMS): The metric is calculated as the MSE of the Cramér's V (measures the association between two categorical variables) for both the real and synthetic data. The metric fluctuates between 0 and 1, where 0 represents the optimal value.
-
MSE Correlation Score (MSCS): It is based on calculating the MSE of the correlations between the variables for both the real and synthetic data. Since the correlation values range from 0 to 1, the metric also fluctuates between these values, where 0 represents the optimal value.
-
Jensen-Shannon divergence score(JSDC): This score is based on Jensen-Shannon divergence. The Jensen-Shannon divergence is calculated between the real and synthetic data for univariate variables for 2 to 2 and 3 to 3 combinations of variables in each case. The purpose of considering the combinations of variables 2 by 2 and 3 by 3 is to detect potential underlying relationships between variables that may not be apparent when analyzing them individually. The score fluctuates between 0 and 1, where 0 represents the optimal value.
-
Linear correlations: straight-line relationships between two variables.
-
Distributions plots: plots of the distributions, continuous, dates and categorical or discrete.
Utility
These metrics may include classification accuracy and the ability of the generated data to be used in ML tasks. One commonly used utility metric is TSTR, which stands for Train on Synthetic, Test on Real. This metric involves training a model on synthetic data generated by the synthesizer and then testing the model on real data to evaluate its performance. If a target is not provided one of the variables will be used as target.
-
TRTR: Train on Real, Test on Real
-
TRTS: Train on Real, Test on Synthetic
-
TSTR: Train on Synthetic, Test on Real
-
TSTS: Train on Synthetic, Test on Synthetic